Trying to pick peaks and troughs?

Trying to pick peaks and troughs?
David Robertson, Head of Economic and Market Research at Bendigo and Adelaide Bank
January 2019
Ten years on from the stock market lows of the GFC (set in the first quarter of 2009) and given the latest volatility, it’s hard not to be reminded of those scary times.
As the chart below of the ASX200 index shows, the price movements were dramatic and extreme falling through 2008 to March 2009; but were almost as volatile with the subsequent recovery over the rest of 2009.
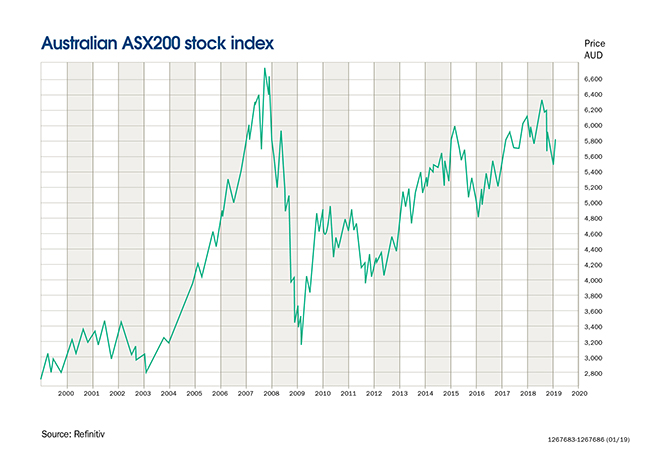
Since then the markets have been better behaved, generally rising - despite the occasional lurch to the downside (including the EU debt crisis period in the second half of 2011) - with the synchronised global upswing reaching a peak in mid-2018, coinciding with a peak in our stock market.
However concerns over global trade tensions, EU/Brexit and rising US interest rates have soured the mood over the last six months, along with a decline locally in property prices. So how should we view these developments in the context of investment strategies?
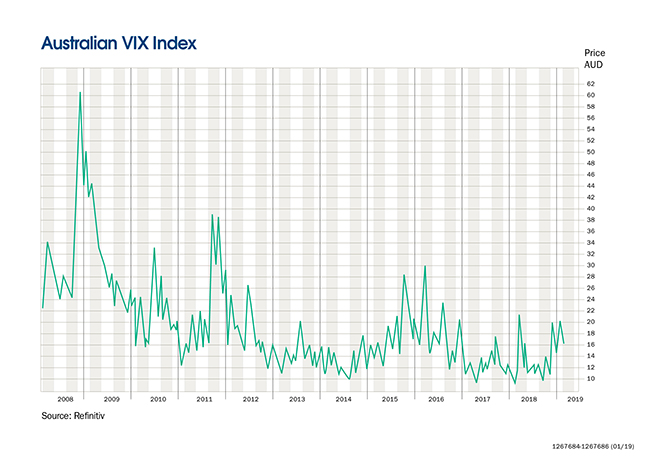
Volatility is never the friend of confidence, and risks inhibiting investment appetite, so the recent rise in volatility best seen in the VIX index (chart below) is a factor in the investment psyche.
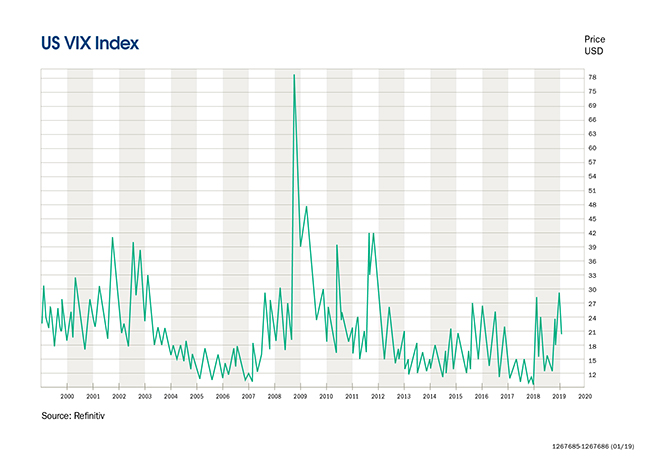
The index is not even close to 2008 GFC levels, and some distance even from 2011 EU Crisis volatility; but while the US stock market has fallen just over 20% since August (officially in a ‘bear market’), here our market hasn’t suffered to the same extent, down 15.1 % peak to trough. As a result our VIX ‘fear index’ has been more benign.
Irrespective of short term volatility and the occasional correction or even bear market, the long term viability of stock markets is hard to argue against.
Buying low is naturally a good approach – but best of luck trying to buy the absolute bottom. More importantly than picking tops and bottoms, ‘time in the market’ is generally the rule of thumb, to even out the impact of volatility.
The average economic cycle is roughly eight years, so ten years may be a good minimum baseline for your equity investment time horizon. Interestingly the case studies below, all based on ten year time periods, all include the extreme price action of the GFC.
In each case a Leveraged geared strategy delivered a better return than an ungeared approach: the ten year periods were modelled starting November 2006, November 2007 and June 2008.
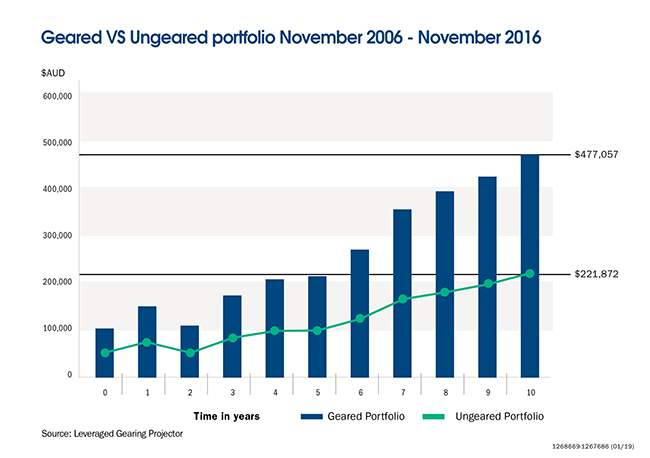
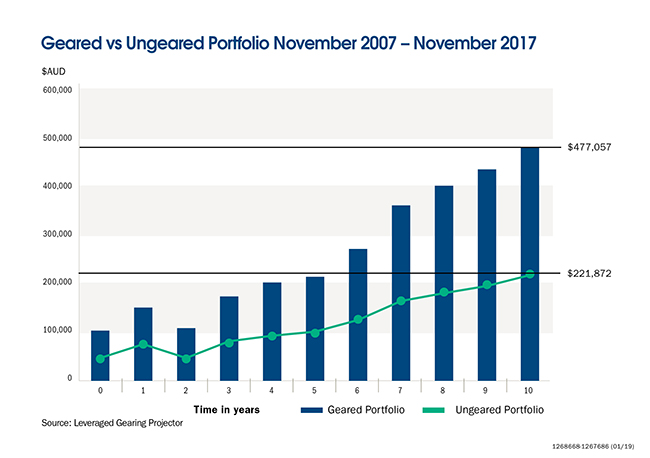
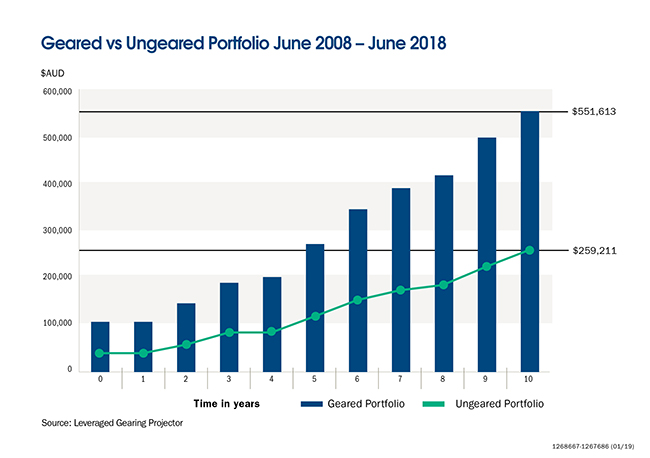
So as well as considering if and when to enter the stock market, the other question to ask is - what is the best gearing ratio for you?
To learn more, talk to your Adviser or Leveraged Relationship Manager, or call us on 1300 307 807.
If you are an adviser please contact us to discuss geared VS non-geared solutions and the tools available to support you.
Things you should know
Gearing involves risk. It can magnify your returns; however, it may also magnify your losses. Issued by Leveraged Equities Limited (ABN 26 051 629 282 AFSL 360118) as Lender and as a subsidiary of Bendigo and Adelaide Bank Limited (ABN 11 068 049 178 AFSL 237879). Information is general advice only and does not take into account your personal objectives, financial situation or needs. The views of the author may not represent the views of the broader Bendigo and Adelaide Bank Group of companies (“the Group”). This information must not be relied upon as a substitute for financial planning, legal, tax or other professional advice. You should consider whether or not the product is appropriate for you, read the relevant PDS and product guide available at www.leveraged.com.au, and consider seeking professional investment advice. Not suitable for a self-managed superannuation fund.
Examples are for illustration only and are not intended as recommendations and may not reflect actual outcomes. Past performance is not an indication of future performance. The information provided in this document has not been verified and may be subject to change. It is given in good faith and has been derived from sources believed to be accurate. Accordingly no representation or warranty, express or implied is made as to the fairness, accuracy, completeness or correction of the information and opinions contained in this article. To the maximum extent permitted by law, no entity in the Group, its agents or officers shall be liable for any loss or damage arising from the reliance upon, or use of the information contained in this article.


